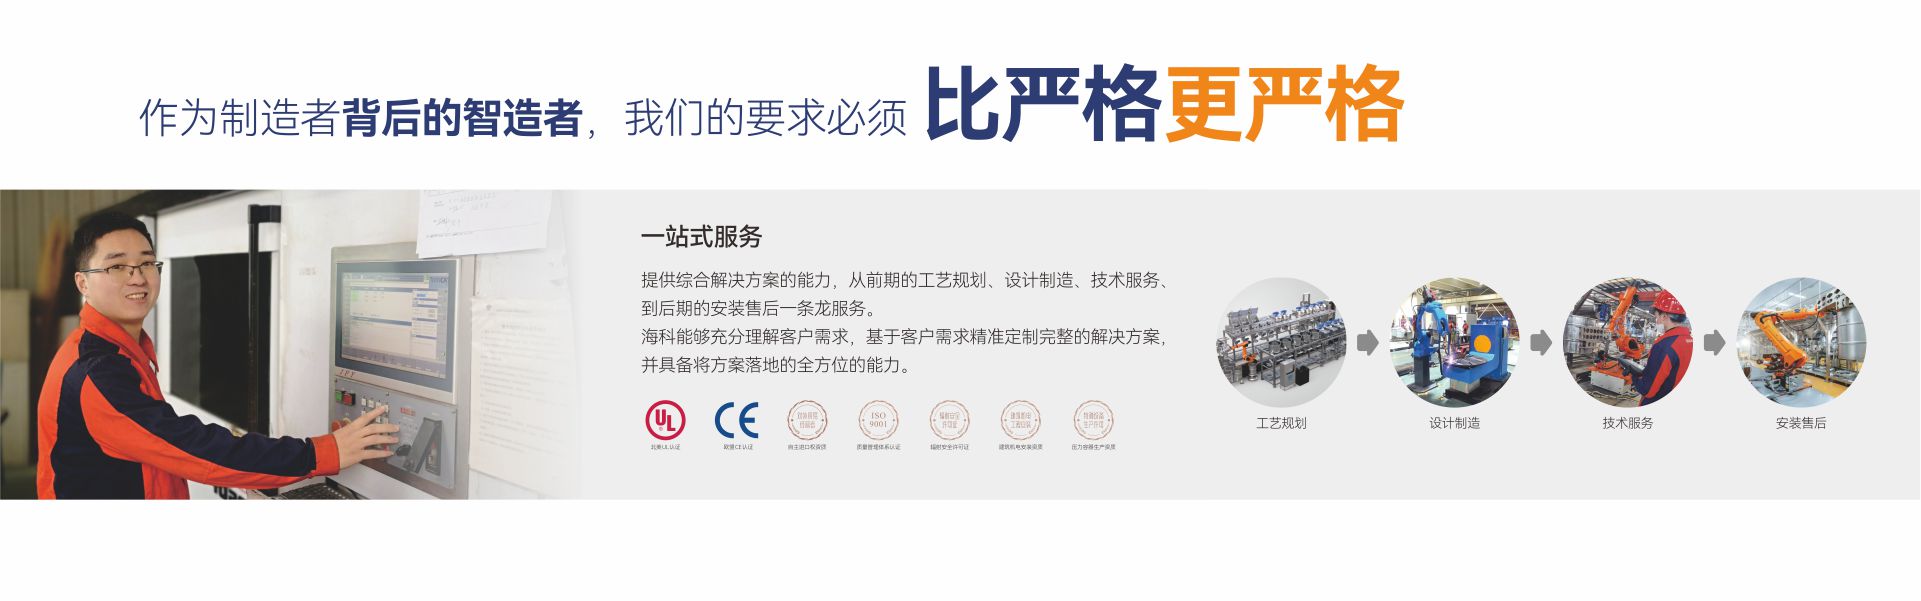
Normal Distribution


Competency
Demonstrate the use of the normal distribution, the standard normal distribution, and the central limit theorem for calculating areas under the normal curve and exploring these concepts in real life applications.
Instructions
Student Profile
Frank has only had a brief introduction to statistics when he was in high school 12 years ago, and that did not cover inferential statistics. He is not confident in his ability to answer some of the problems posed in the course.
Concept Being Studied
Finding areas and probabilities by using the standard normal distribution.
As Frank’s tutor, you need to provide Frank with guidance and instruction on a worksheet he has partially filled out. Your job is to help him understand and comprehend the material. You should not simply be providing him with an answer as this will not help when it comes time to take the test. Instead, you will be providing a step-by-step breakdown of the problems including an explanation on why you did each step and using proper terminology.
What to Submit
To complete this assignment, you must first download the Deliverable_02_Questions_ma, and then complete it by including the following items on the worksheet:
• Incorrect Answers
o Correct any wrong answers. You must also explain the error performed in the problem in your own words.
• Partially Finished Work
o Complete any partially completed work. Make sure to provide step-by-step instructions including explanations.
• Blank Questions
o Show how to complete any blank questions by providing step-by-step instructions including explanations.
Your step-by-step breakdown of the problems, including explanations, should be present within the word document provided. You must also include an excel workbook which shows all your calculations performed.
Deliverable 02–Worksheet

Instructions:The following worksheet is shown to you by a student who is asking for help. Your job is to help the student walk through the problems by showing the student how to solve each problem in detail. You are expected to explain all of the steps in your own words.
Key:
<i>- This problem is an incorrect.Your job is to find the errors, correct the errors, and explain what they did wrong.
<p>- This problem is partially finished.You must complete the problem by showing all steps while explaining yourself.
<b>- This problem is blank.You must start from scratch and explain how you will approach the problem, how you solve it, and explain why you took each step.

<p>Assume that a randomly selected subject is given a bone density test. Those tests follow a standard normal distribution. Find the probability that the bone density score for this subject is between -1.93 and 2.37

Student’s answer:We first need to find the probability for each of these z-scores using Excel.
For -1.93 the probability from the left is 0.0268, and for 2.37 the probabilityfrom the left is 0.9911.

Continue the solution:


<b>The U.S. Airforce requires that pilots have a height between 64 in. and 77 in. If women’s heights are normally distributed with a mean of 63.8 in. and a standard deviation of 2.6 in, find the percentage of women that meet the height requirement.

Answer and Explanation:


<i>Women’s pulse rates are normally distributed with a mean of 69.4 beats per minute and a standard deviation of 11.3 beats per minute. What is the z-score for a woman having a pulse rate of 66 beats per minute?

Student’s answer:
Let z = ((x-μ))/σ

z = (69.4 – 66)/11.3

z = 0.03

Corrections:

<b>What is the cumulative area from the left under the curve for az-score of -1.645? What is the area on the right of that z-score?

Answer and Explanation:


<i>If the area under the standard normal distribution curve is 0.8980 from the right, what is the corresponding z-score?

Student’s answer:We plug in “=NORM.INV(0.8980, 0, 1)” into Excel and get an area of 1.27.

Corrections:


<p>Manhole covers must be a minimum of 22 in. in diameter, but can be as much as 60 in. Men have shoulder widths that are normally distributed with a mean of 18.2 and a standard deviation of 2.09 in. Assume that a manhole cover is constructed with a diameter of 22 in. What percentage of men will fit into a manhole with this diameter?

Student’s answer:We need to find the probability that men will fit into the manhole. The first step is to find the probability that the men’s shoulder is less than 22 inches.

Continue the solution:


WE ARE THE LEADING ACADEMIC ASSIGNMENTS WRITING COMPANY, BUY THIS ASSIGNMENT OR ANY OTHER ASSIGNMENT FROM US AND WE WILL GUARANTEE AN A+ GRADE

Unlike most other websites we deliver what we promise;

  • Our Support Staff are online 24/7
  • Our Writers are available 24/7
  • Most Urgent order is delivered with 6 Hrs
  • 100% Original Assignment Plagiarism report can be sent to you upon request.

GET 15 % DISCOUNT TODAY use the discount code PAPER15 at the order form.

Type of paper Academic level Subject area
Number of pages Paper urgency Cost per page:
 Total: